White paper
Talent on the critical path
Why new assets wait for people, and what each week costs
Download PDF10 pages, 1.5 MB

In brief
A week between handover and output at rate costs six to eight figures. Readiness is repaid by avoiding a few weeks of it.
Capital is spent at once. The return starts only when people can run the asset at rate. The weeks between those two dates are a cost almost no capital plan books, and people are one of their documented causes.
- The gap is large and public. Public records show assets waiting months to years for output: a waste plant program estimated at $8.3 billion, where 16 more months were requested to hire staff and ramp up; Navy shipyards where the workforce contributed to more than 4,000 days of maintenance delay over the same five years as $2.8 billion of investment; a chip fab whose production slipped from 2024 to 2025, which the company put down to too few skilled installers.
- A week of that gap costs six to eight figures. Idle capital sets the floor. Add mobilized crews and forgone margin and it reaches $1 million or more.
- Readiness is repaid by a few weeks of avoided delay. In the two practice cases in this paper, the training budget paid for itself if it avoided one to seven weeks of delay, depending on what a week is counted to cost.
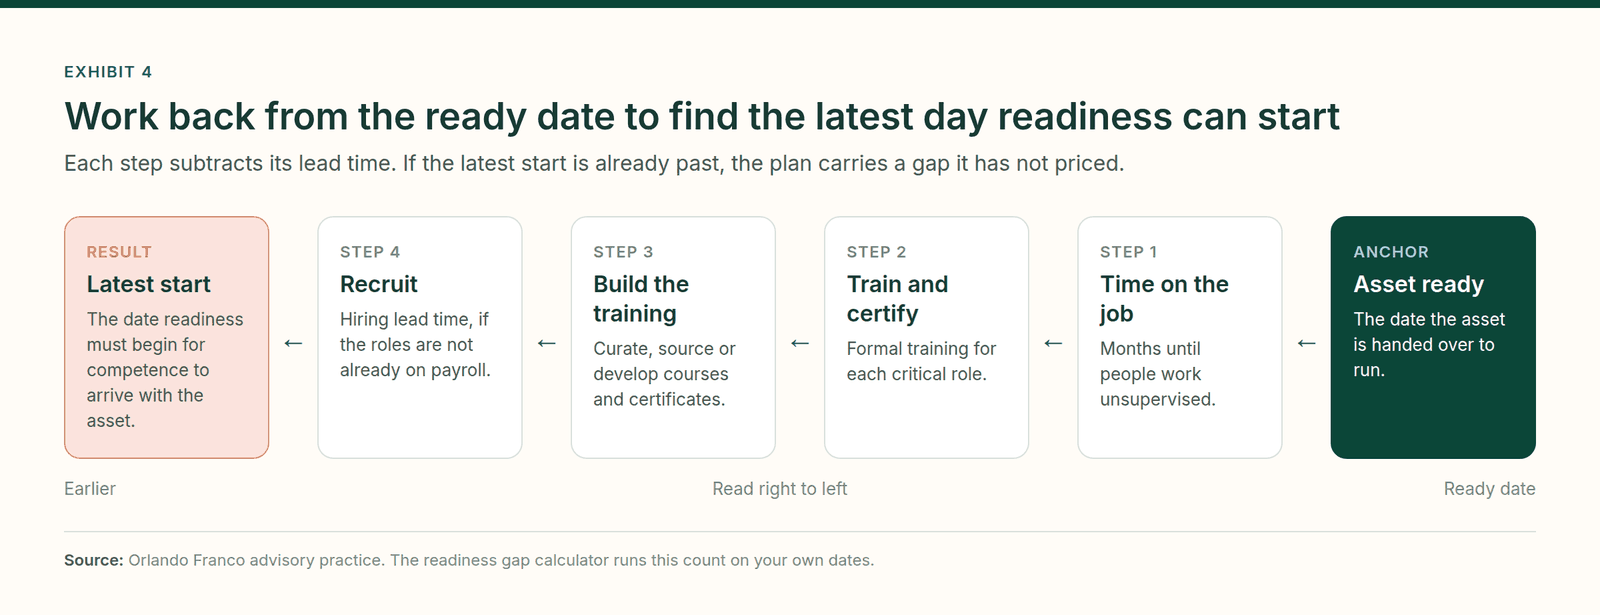
- The problem is timing, not speed. Competence cannot be hired on handover day, so the readiness start date has to be worked back from the ready date, like a long-lead equipment order.
- The evidence has a limit. None of the open sources used here measures how much earlier readiness brings the return forward. Talent is one cause of delay among several; readiness started in time raises the odds of a shorter gap, it does not guarantee one.
Give readiness an owner, a line in the capital case, and a start date.
1 · The line nobody books
Every capital case has two dates. Plans usually treat them as one.
The first date is when the asset is ready. The second is when people can run it at rated output. The weeks between them are the readiness gap, and they seldom have an owner.
The cost methods explain why. A US national laboratory's power plant method budgets six months of operating labor before start-up to train operators, and says capital contingency does not cover labor productivity or post-startup performance. UK Treasury guidance sets uplifts for late builds and cost overruns, but found too little data to set one for benefits that fall short. The construction schedule has an owner and a contingency. The ramp to rate has neither.
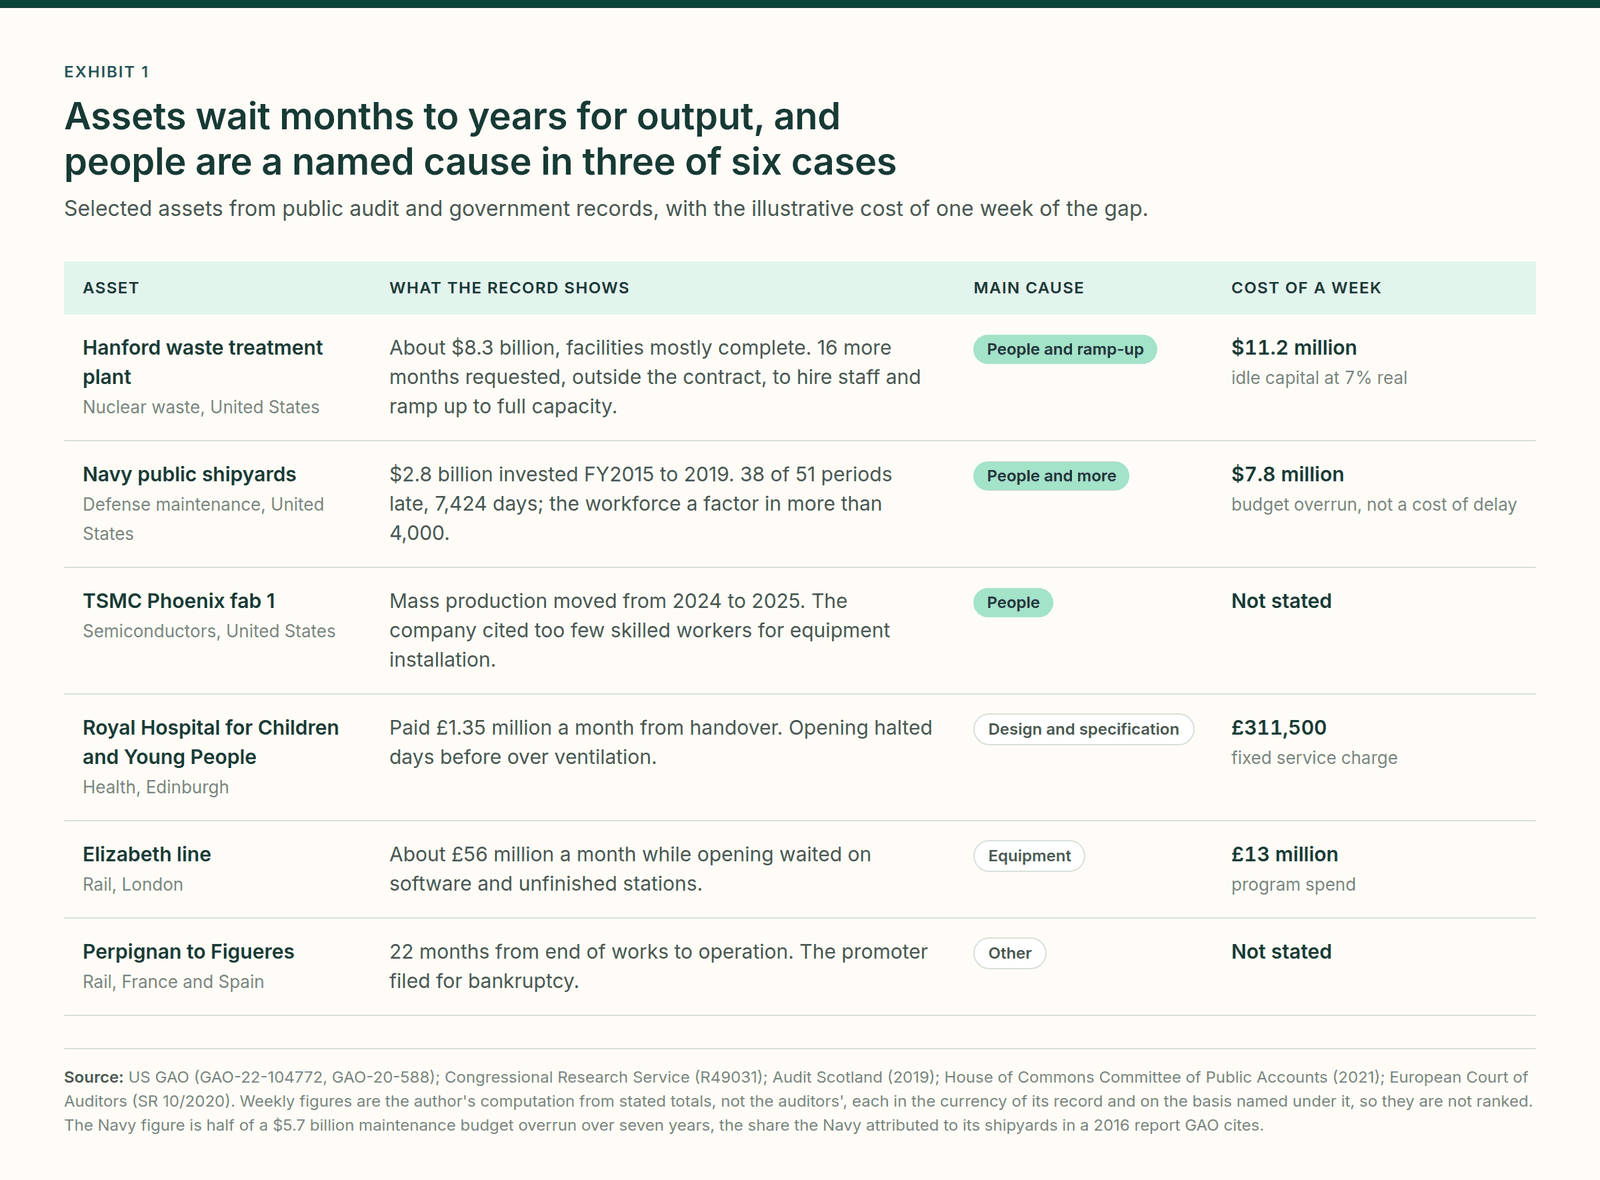
Two lessons follow. First, people appear as a named cause in three of the six cases, beside equipment and design. Second, a week costs the same whatever the cause. What differs is whether the cause could have been started earlier. People readiness is one that can.

2 · Competence takes years
You can hire a person in weeks, not their experience.
Output climbs a curve, not a step. In wartime US shipyards, man-hours per ship fell 16 to 22 percent each time cumulative output doubled, and yards new to a ship type needed more hours than experienced ones. A new site starts at the top of that curve.
The curve is still long today. The IEA notes that for clean energy factories, ramp-up can take as long as construction; Tesla's first Nevada gigafactory took three to four years to reach nominal capacity, by different accounts. One assessment of European battery plants assumes five years for new players to climb from 40 to 85 percent utilization, against three years from 55 to 85 percent for established ones.
Much of the curve is people. Competence has two parts, formal training and time on the job, and plans tend to count only the first.
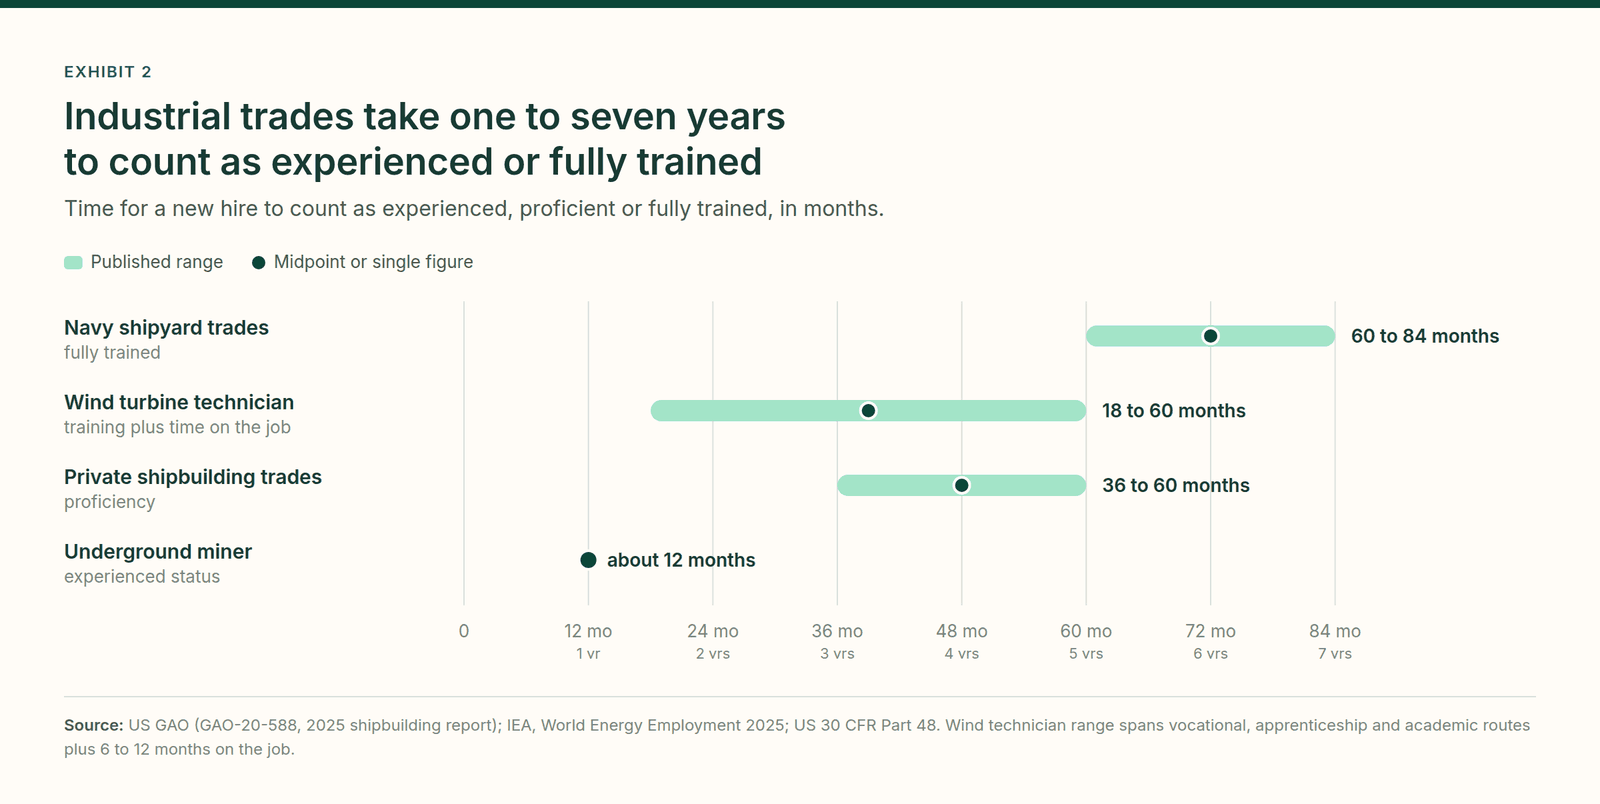
Mass hiring dilutes experience. At Puget Sound Naval Shipyard, 45 percent of the skilled workforce had under five years' experience. That matters for safety as well as output: in US mining from 1995 to 2004, first-year workers accounted for 28 percent of injuries and 31 percent of fatalities, as NIOSH researchers report.
3 · The order of magnitude
A week of delay against a budget of about a million.
The decision turns on one comparison: what a week of delay costs, against what readiness costs. In the two cases here, the budget equals between one and seven weeks of delay. A week of delay has three parts:
- Idle capital: capital deployed times the annual rate, divided by 52. On $100 million at 7 percent, about $135,000 a week. Costs already incurred count here, through the cost of carrying them, not a second time.
- Mobilized resources: crews, contractors, equipment hire and site overheads that keep costing while the asset waits. In the second case below it is the biggest part, on the figure assumed.
- Margin forgone or fixed charges: what the asset should earn, or what is paid whether it runs or not.
A readiness budget is sized bottom-up: the people who must be competent, the certificates each needs, the cost of each. In my practice, at current per-certificate prices, it typically lands between high five and mid six figures, more where professional content has to be developed. A reference project of €300 million, training 2,000 people in five certificates each at $60, comes to about $600,000. As an illustration, the same project at a professional $200 per certificate comes to about $2 million, before expert curation. The project is stated in euros and the certificates in dollars, as they are priced.
Break-even says how many weeks of delay readiness must avoid to pay for itself. It does not say it will avoid them.
The two cases that follow carry budgets of about $1 million each, above that range, for different reasons: the first is priced at what certificates cost at the time, $750 to $1,000 each, and the second at commercial value, about $5,000 a person.
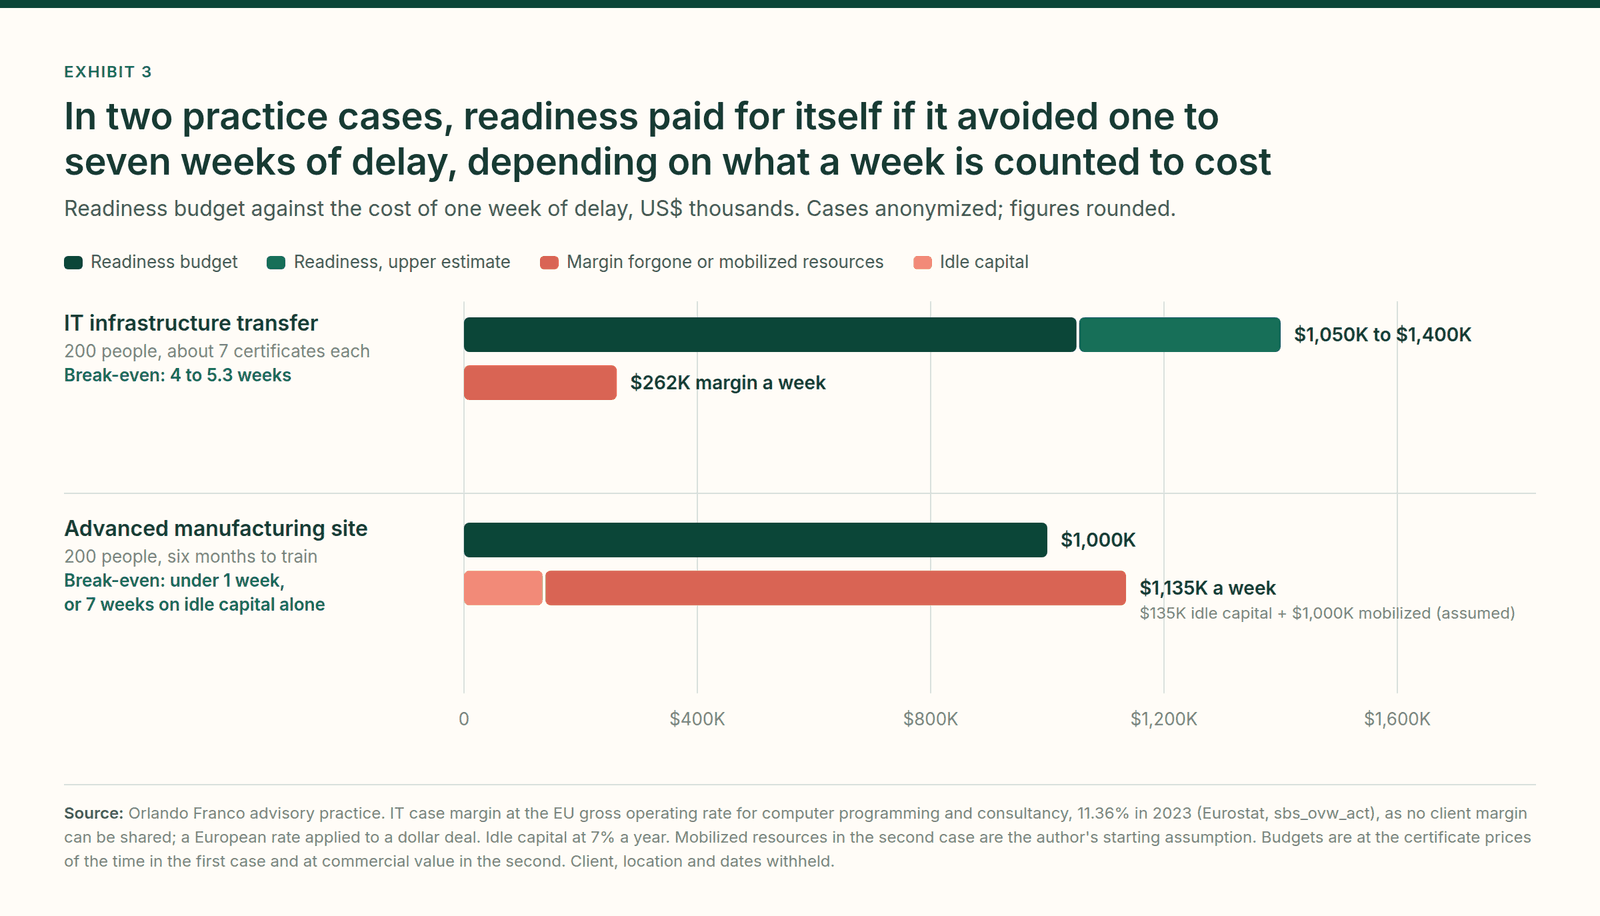
In the first case, an IT services company took over a financial services client's infrastructure in a nine-figure deal, hired most of the client's support team and retrained them in parallel with the transfer. On revenue the released capacity was worth about $2.3 million a week; I use margin because it is the fairer measure. Even on margin, the training paid back in about a month, and the transition shortened by roughly four.
The second case shows where the real cost sits. On idle capital alone, readiness needs seven weeks to pay back. Add mobilized resources, assumed here at $1 million a week, and it needs less than one.
4 · Timely, not faster
The lever that is left is the start date.
The usual framing is to train faster. It misses the constraint. Competence has a floor set by time on the job, and the window to build training and train people is thin.
There is rarely a green light for readiness. In my experience it usually starts late. So I work backwards from the date the asset is ready.
Timely readiness is unremarkable when it works. For a new plutonium pit plant at Savannah River, around 2,000 staff are to be hired and trained several years before operations, with staff sent to Los Alamos since 2020 to learn the work. When the idle Yuma Desalting Plant restarted for a pilot run in 2010, 20 contract staff were hired about two months ahead to train and prepare equipment; the run reached a third of capacity in two days and cost 31 percent less than budgeted, mainly on labor, power and chemicals. UK project guidance asks whether readiness for handover to operations is on the board's agenda.
5 · What to do
Five moves for finance and operations leaders.
None of these needs a new function. They need readiness to be treated as a scheduling and budget fact, in the same plan as the equipment.
| Move | The CFO asks | The COO does |
|---|---|---|
| 1. Book the second date | Where is the date this asset runs at rate, not only the handover date? | Sets the at-rate date and the ramp curve it assumes |
| 2. Price the week | What does one week between the two dates cost, floor and full? | Supplies mobilized resources and margin; finance adds idle capital |
| 3. Size readiness from the work | Is there a readiness line, and what is it built from? | Maps critical workstreams, the skills gap, the certificates and their cost |
| 4. Set the latest start | When must readiness start for competence to arrive with the asset? | Works back from the ready date and approves readiness with the capital |
| 5. Give it an owner and a range | Who owns readiness, and what happens if the ramp is slower? | Puts readiness on the board agenda; runs a planned, a slow and a late case |
On move 3, the order matters. The sizing starts with the team that needs the skills: operations, commercial or product development. Finance and HR come in as custodians and stakeholders, not as the starting point. In six steps: map the critical workstreams, assess the skills gap, translate it into a catalog of courses or certificates, size the demand, prioritize and calibrate it, and check what content exists and what must be curated or sourced.
Where it goes wrong is predictable. Timelines are underestimated, corporate decisions stall, and talent acquisition runs into problems. Each of these eats the thin margin between the latest start and the ready date.

6 · Limits
What the evidence does not show.
The case for timely readiness rests on the size of the gap and the cost of a week, not on a proven multiplier. Three limits deserve stating plainly.
- None of the sources used here measures the payoff. None of the public records used here measures how much earlier readiness brings the return forward. A European review found around 65 percent of evaluated labor shortage measures had only basic or incomplete evidence of impact. An EU study suggests training offset lost sales from skill shortages in large firms, but not in small and medium-sized ones.
- Causes overlap. Auditors name people beside equipment and design, companies also cite funding, and GAO notes the shipyard factors do not add up to the total. No delay in this paper is split into a people share and an equipment share, because the sources do not measure that split.
- The practice cases are two, and recounted. They show the order of magnitude, not a rate of return. The margin in the first case is a sector benchmark, not the client's.
This paper does not rely on vendor or consultancy ramp-up statistics. The one industry assumption it quotes, on battery plant utilization, comes through peer-reviewed research and is labeled as an assumption.
Next step
Size the gap on your own asset.
About
The author
Orlando Franco is a strategic advisor with 15 years' experience in corporate scaling, technology, data and operations. He advises organizations on whether the design of a complex program will deliver the outcome it was approved for, including the readiness of the people who have to run it. The practice cases in this paper come from engagements where he was the consultant and the client did the work; they are anonymized to sector level.
Method and sources
Facts about named assets come from public audit, parliamentary and government records, national statistics and open research, each checked against its source. Weekly costs are the author's computation from the totals those sources state. Practice figures are the author's own, rounded.
- US GAO, GAO-20-588, Navy Shipyards: Actions Needed to Address the Main Factors Causing Maintenance Delays, 2020.
- US GAO, GAO-22-104772, Hanford Cleanup: DOE Has Opportunities to Better Ensure Effective Startup and Sustained Low-Activity Waste Operations, 2022.
- US GAO, GAO-23-104661, Nuclear Weapons: NNSA Does Not Have a Comprehensive Schedule or Cost Estimate for Pit Production Capability, 2023.
- US GAO, depot workforce report (2018) and Navy shipbuilding industrial base report (2025).
- Congressional Research Service, Semiconductor Fabrication Facilities Funded by the CHIPS Act, 2026.
- Audit Scotland, Delay to the opening of the Royal Hospital for Children and Young People, 2019.
- House of Commons Committee of Public Accounts, Crossrail: A progress update, 2021.
- European Court of Auditors, Special Report 10/2020: EU transport infrastructures, 2020.
- HM Treasury, Supplementary Green Book Guidance: Optimism Bias.
- Infrastructure and Projects Authority, Project Routemap: Systems Integration, 2021.
- NETL, Cost Estimation Methodology for NETL Assessments of Power Plant Performance, 2021.
- OMB, Circular A-94; 7 percent base-case real discount rate in the 1992 edition.
- US Bureau of Labor Statistics, Productivity changes in selected wartime shipbuilding programs, 1945.
- IEA, Energy Technology Perspectives 2023; World Energy Employment 2025.
- Link and colleagues, Feasibility of meeting future battery demand via domestic cell production in Europe, Nature Energy, 2025.
- US Bureau of Reclamation, Yuma Desalting Plant Pilot Run Final Report, 2012.
- Eurofound, Measures to tackle labour shortages: Lessons for future policy, 2023.
- JRC, Adapting to skill shortages: what strategies to follow?, 2024.
- Eurostat, Enterprises by detailed NACE Rev. 2 activity (sbs_ovw_act), gross operating rate, 2023.
- US 30 CFR Part 48; Haas and colleagues (NIOSH), 2019.
© 2026 Orlando Franco. All insights